Q-View 2.0 Quality Assessment and Discharge Results All-in-One Report
RDI has made extensive enhancements to this software based on customer feedback.The first version of Q-View was heavily focused on assessing the quality of data on-site in the field during data collection. Q-View 2.0 is now more heavily focused on analysing and reporting data after the user has returned to the office. To this end, Q-view now delivers an All-in-One professional report that combines a summary of discharge results with a comprehensive quality assessment.
In-depth qualification of discharge measurements is supported including:
• A single universally-accepted measurement quality score and 100-point grading system
• Uncertainty-based quality control
• Discharge measurement sensitivity analysis
• Detailed discharge statistics
• Uncertainty analysis for both individual transects and the entire measurement
• Instant data qualification for the field user, saving valuable time while ensuring collected the data meets the user’s needs
• Accelerated processing, allowing users to create multiple data reports and analyses in a fraction of the time
• Seamless, user-friendly integration with WinRiver II, eliminating the need to learn a new software platform
Q-View has two built-in quality grading systems: TRDI’s new 100-point grading system and an Australian grading system, to provide a quantitative measure of the overall quality of moving-boat ADCP streamflow measurements. These two grading systems help emphasise a due diligence by the ADCP user for following standard quality assurance procedures, while quickly identifying any non-compliance.
Pricing for this software remains unchanged for two licenses (allowing a technician to have one copy for the office, and one for the field).
 Q-View 2.0 Quality Assessment and Discharge Results All-in-One Report (1573 KB)
 |
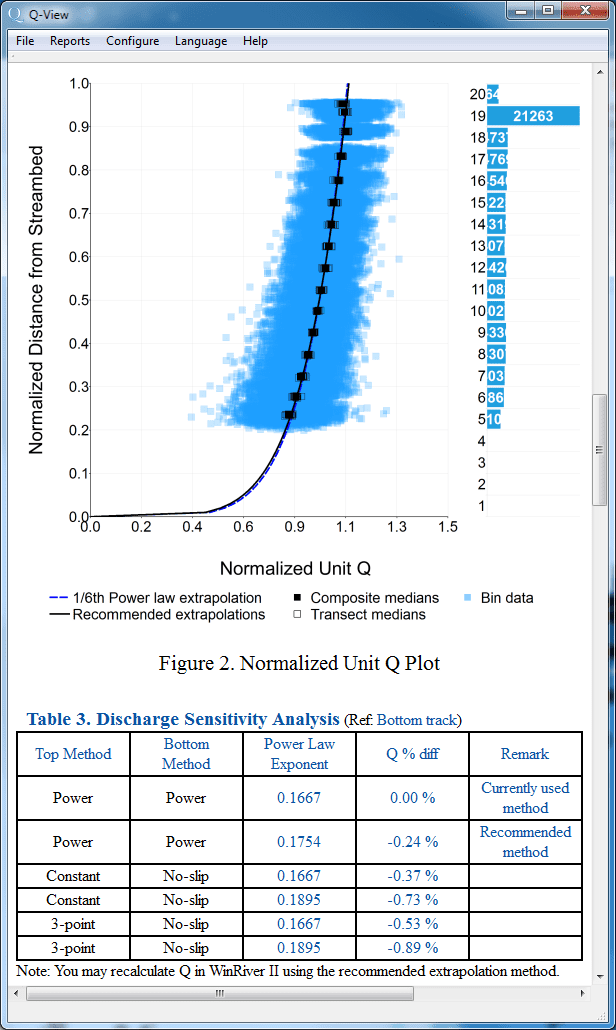
| Q-View 2.0 Normalized Unit Q Plot and Table. |
 |
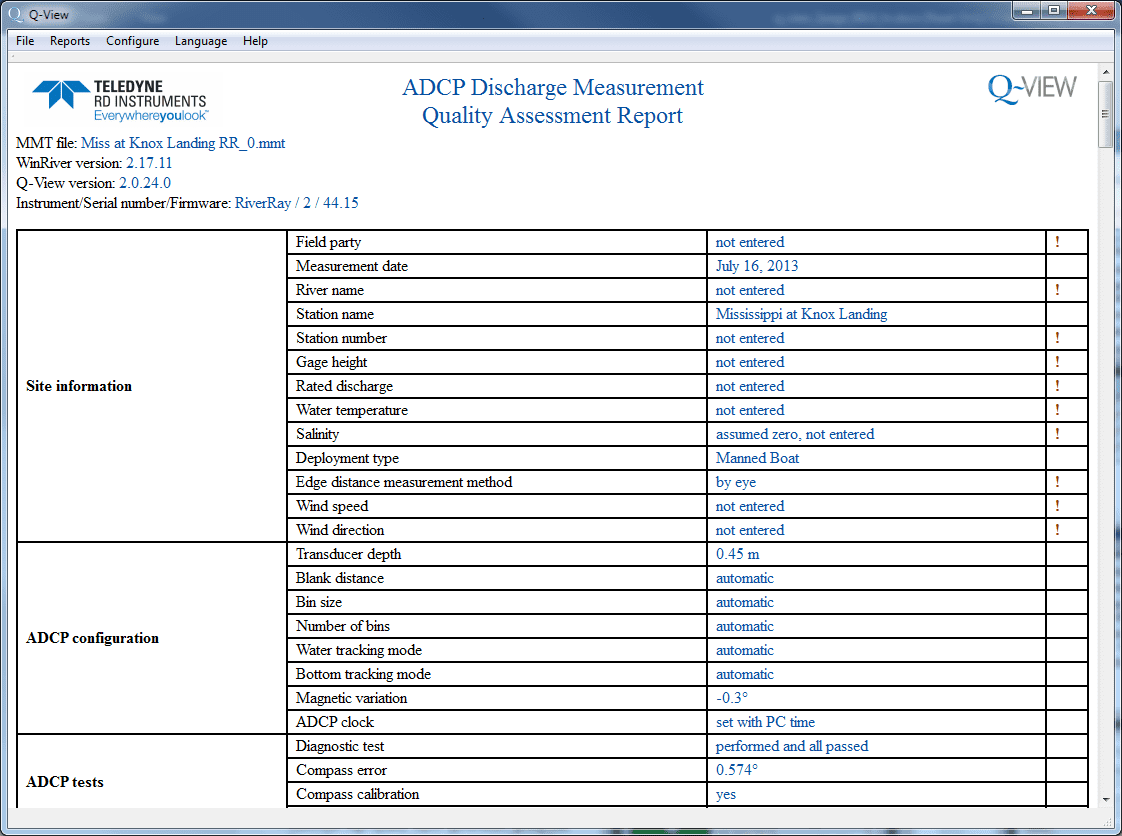
| ADCP Discharge Measurement Quality Assessment Report. |


